


The metrics that turn customer support into a revenue engine.
If the headline numbers on your CX dashboard are tickets closed, time to first response, average handle time, and a CSAT score collected from a one-question survey nobody fills out, the function is wired as a cost center, regardless of what the leadership deck says about "customer obsession."
The standard CX dashboard was built for a different era. It measures whether the queue is being processed. It does not measure whether problems were actually solved, whether revenue was preserved, or whether the function generated any economic value beyond throughput.
Why the legacy metrics fail
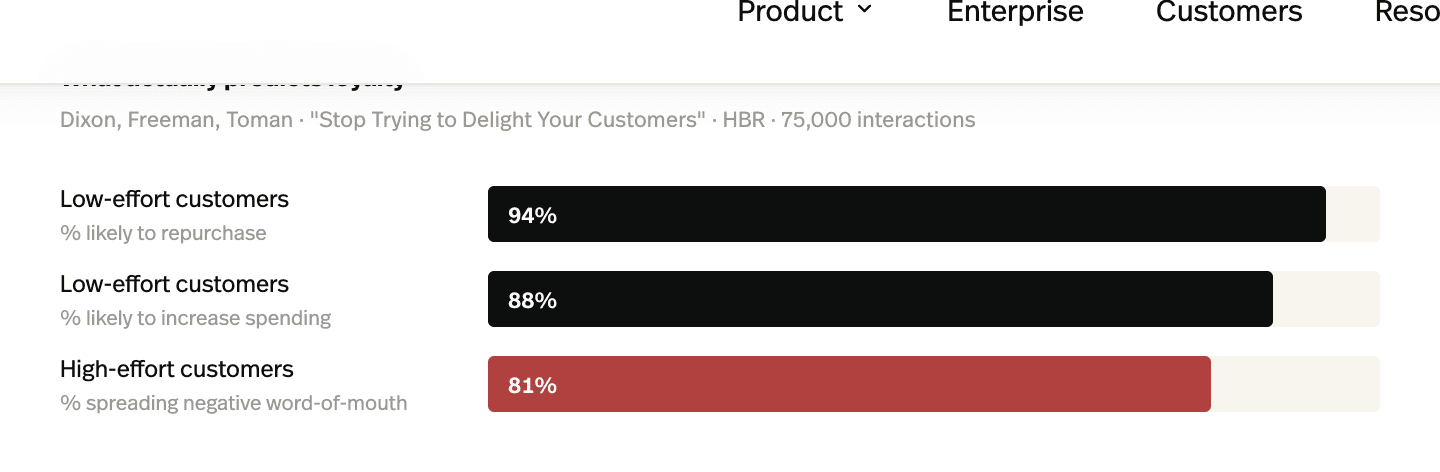
The most rigorous attack on the legacy CX dashboard is also the most cited: the Corporate Executive Board's 2010 study of 75,000 customer interactions, written up by Dixon, Freeman, and Toman in Harvard Business Review as "Stop Trying to Delight Your Customers." The study's core finding was that traditional satisfaction and recommendation metrics, CSAT, NPS, were weakly predictive of repeat purchase and loyalty. What predicted loyalty was effort: how hard it was for the customer to get the issue resolved.
A team can hit a five-minute TTFR target while delivering a ten-day actual resolution and an aggravating customer experience along the way, and the dashboard will look excellent.
The legacy metrics aren't useless. They're floor metrics. They tell you the engine is running. They don't tell you whether it's producing anything worth running it for.
The four metrics that actually matter
The replacement set is short, specific, and economically anchored. Each metric ties cleanly to either cost savings or revenue impact. Each can be reported to a CFO without translation.
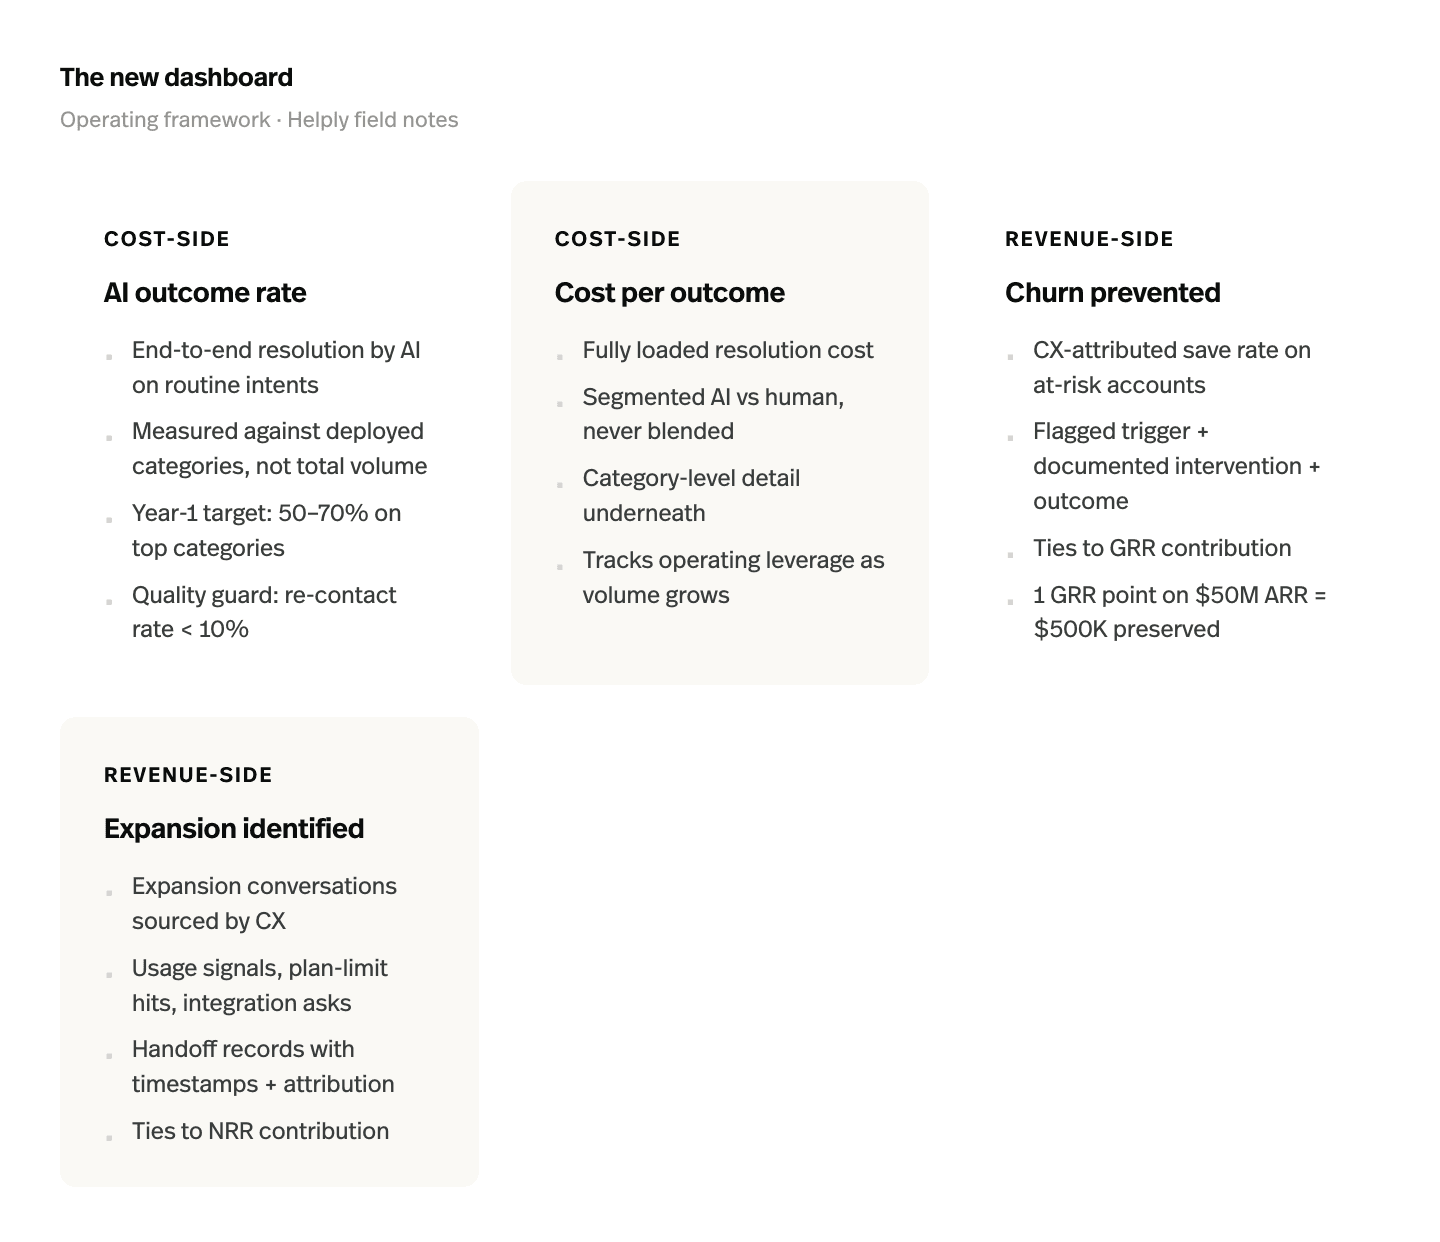
1. AI outcome rate
End-to-end resolution by the AI agent on routine ticket categories, measured against tickets the AI was deployed against, not against total ticket volume. This is the cost-side metric. It captures how much of the routine queue has actually been moved off human time.
A useful operating target for a B2B team in the first year is 50–70% on the top automated categories, climbing past 70% as the feedback loop matures. The number to be suspicious of is anything north of 80% in the first quarter, that usually means the AI is "deflecting" rather than resolving and the re-contact rate will reveal it.
2. Cost per outcome
Fully-loaded resolution cost, segmented by AI versus human. The discipline here is the segmentation. A blended number flatters the human side and undersells the AI side; the leadership view should always show both, with category-level detail underneath. The point of tracking it is operating leverage, how the marginal resolution cost changes as volume grows. In the legacy model, that curve was flat. In the new model, it should be declining.
3. Churn prevented
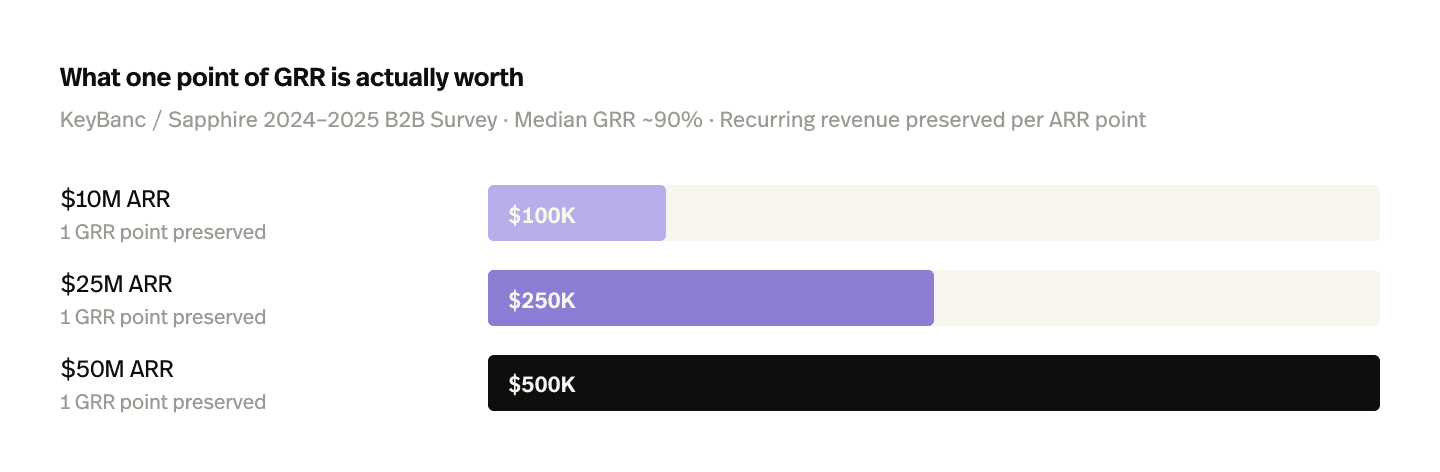
The retention-side revenue metric. Operationally, it's a CX-attributed save rate on flagged at-risk accounts: accounts where the team identified a churn signal, ran a defined intervention, and measurably averted the churn event. The attribution discipline matters, flag the account before the intervention, document the trigger and the response, track the renewal outcome. Without that discipline, the number is unauditable.
This is the metric most CX teams have never reported. It's also the one with the largest dollar consequences.
4. Expansion identified
The growth-side revenue metric. Operationally, it's the count and conversion rate of expansion conversations sourced by CX, usage signals, contract-clause inquiries, integration questions, plan-limit hits, handed to sales with timestamps and attribution intact.
The same KeyBanc survey shows median net retention at roughly 101%, with top-quartile performers at 108–110% and the OpenView benchmark on top-quartile NRR sitting above 120%. The gap between median and top quartile is mostly expansion. CX is one of the cheapest places to source it.
How each ties to revenue or cost
The four-metric set maps onto the financial statement directly.
- AI outcome rate compresses cost-of-services on the routine layer, operating expense down.
- Cost per outcome drives operating leverage, gross margin up as the function scales.
- Churn prevented preserves recurring revenue, GRR up, net new ARR less burdened with backfill.
- Expansion identified contributes to net revenue retention, NRR up, sales-pipeline efficiency up because warmed signals close better than cold ones.
A CFO can reconcile every one of those lines against the financial model. None of them require translating "customer satisfaction" into a dollar figure through a chain of correlation arguments.
Reporting it to leadership
The reporting structure that makes the metrics stick has three components.
The quarterly CX scorecard, formatted like a P&L line
Cost saved (cost per outcome improvement × resolved volume). Revenue retained (CX-attributed save rate × ARR at risk on flagged accounts). Revenue identified (expansion conversations sourced × downstream close rate × ACV uplift). Net economic contribution. Reported alongside, not in place of, the operating metrics. The board will ask about the operating metrics if the economic contribution number looks wrong; otherwise, they shouldn't lead.
Attribution discipline
Every "saved" account needs a flagged-account record, a timestamped trigger, a documented intervention, and a renewal outcome. Every expansion conversation sourced from CX needs a handoff record with the originating signal. Without that discipline, the scorecard looks like a sales document and gets read like one.
Language
The CX function reporting in CFO terms, ARR retained, GRR contribution, NRR uplift, cost-to-serve, gets treated as a revenue function. The CX function reporting in CSAT and TTFR gets treated as a cost line.
The numbers are real either way. The framing determines which P&L line the executive team mentally puts them under.
The shift
The metrics on the wall determine the work the team does. Move the headline numbers from throughput to outcome, AI outcome rate, cost per outcome, churn prevented, expansion identified, and the function follows. Leave the legacy dashboard in place, and no amount of new tooling will produce different behavior, because behavior follows measurement.
This is the cheapest leadership intervention available, and one of the highest-leverage. The dashboard is the playbook.
The four metrics, in your helpdesk
Helply reports against this metric set out of the box: AI outcome rate (with re-contact rate as the quality guard), cost per outcome segmented AI/human, churn signals routed to CS with attribution, and expansion conversations handed to sales. See how it works →
Sources

